Xmindmap Note

Download Link:
https://wwr.lanzoui.com/iH1A2r0iw5c password:bdut
The main window looks like the image below. The open source tool is written by using Matlab GUI. So the Matlab Runtime needs to be installed in your PC. Please read the README.txt file before running it.
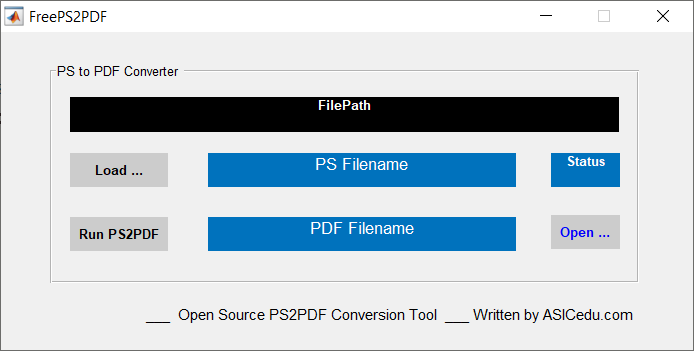
If you like it and have any comments, please feel free to contact me by email: asic_at_asicedu.com.
Download winPython and open the spyder to install the yfinance at first
pip install yfinance
Launch Jupyter notebook and create a new one as below
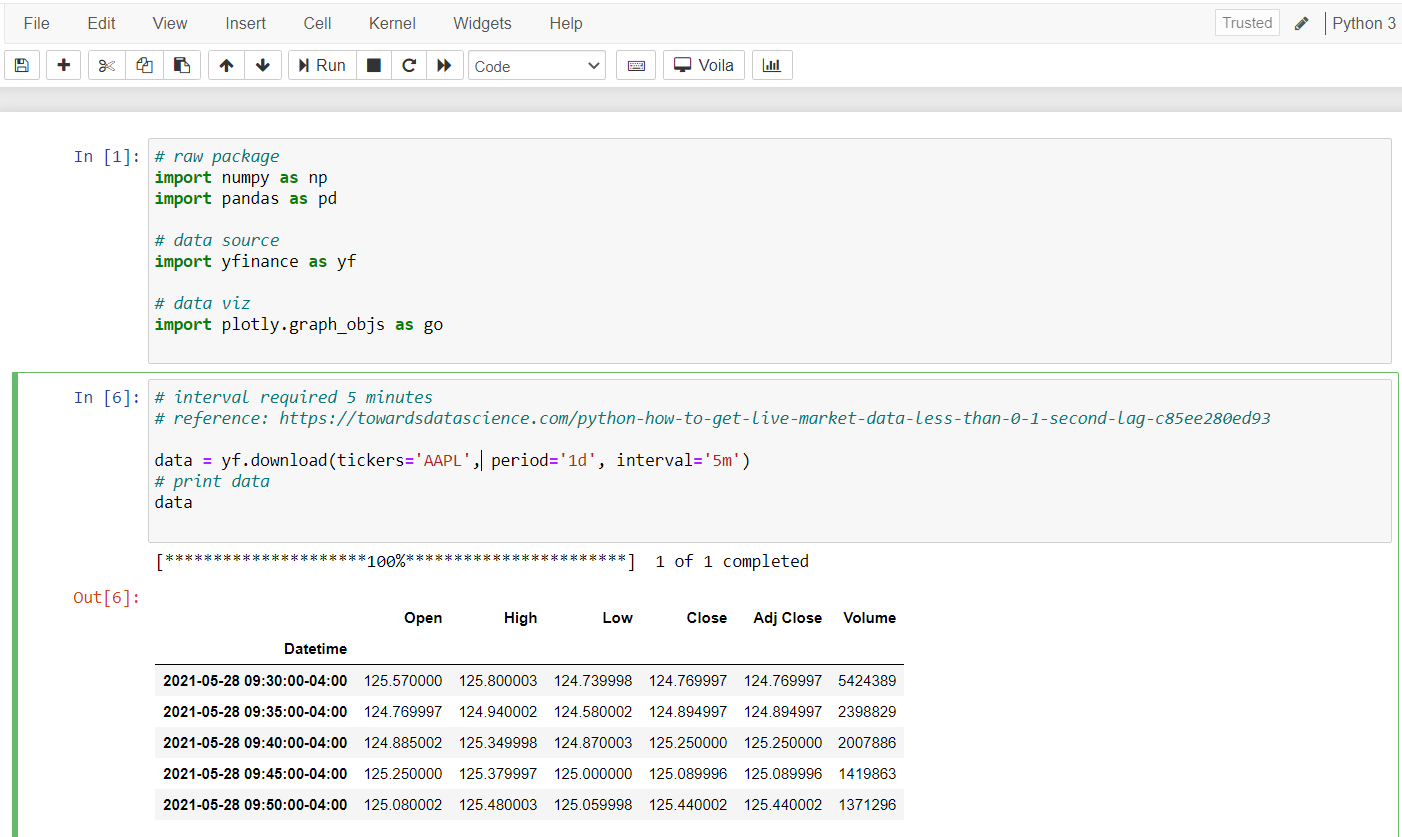
xxxxxxxxxx181import yfinance as yf2import matplotlib.pyplot as plt3import numpy as np4import pandas as pd56# define the ticker symbol7tickerSymbol = 'MSFT'89# get data on this ticker10tickerData = yf.Ticker(tickerSymbol)1112# get the historical prices for this ticker13tickerDf = tickerData.history(period='1d', start='2018-1-1', end='2021-5-30')1415# see data16tickerDf17
xxxxxxxxxx61tickerDf['Close'].plot()2plt.xlabel("Date")3plt.ylabel("Close")4plt.title("Miscrosoft Price data")5plt.style.use('dark_background')6plt.show()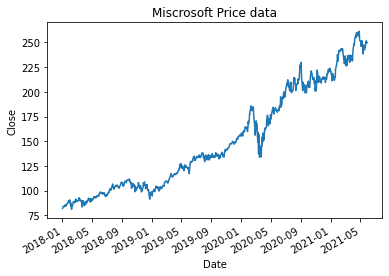
xxxxxxxxxx21# info on the company2tickerData.infoxxxxxxxxxx21# get event data for ticker2tickerData.calendar| 0 | 1 | |
|---|---|---|
| Earnings Date | 2021-07-20 00:00:00 | 2021-07-26 00:00:00 |
| Earnings Average | 1.9 | 1.9 |
| Earnings Low | 1.64 | 1.64 |
| Earnings High | 2.03 | 2.03 |
| Revenue Average | 44105500000 | 44105500000 |
| Revenue Low | 40850000000 | 40850000000 |
| Revenue High | 45019500000 | 45019500000 |
xxxxxxxxxx21# get recommendation data for ticker2tickerData.recommendations
Some time I would like to use google sheet to create a table to list the key bindings of EDA tools.
In order to track and memorize the key bindings, it is very helpful to create Anki flashcards.
Reference YouTube video: importing into Anki from Google Sheets - chemical equation - YouTube
Anki plugin:
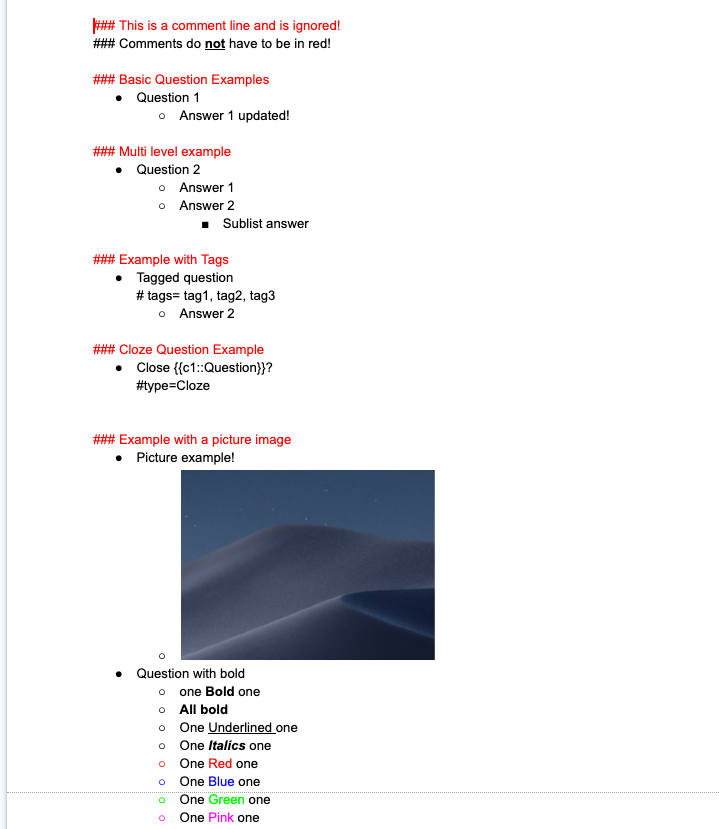
The above Anki plugin is very useful. It converts google docs into anki flashcards.
When using google docs to write the questions and answers, please follow the example as below.
Hide Unused columns in Google Sheets
If you don’t want unused rows and columns to be visible in the Google Sheets worksheet, you can easily hide these.
Below are the steps to hide unused columns in Google Sheets:
- Select the first column next to the last used column. You need to select the entire column by clicking on the column header at the top.
- Hold the CONTROL and SHIFT keys and press the right-arrow key. This will select all the unused columns.
- Right-click on any of the selected columns and click on the Hide Columns E-Z option (in your case, it may show different column alphabets based on what columns you have selected.
In Step 3, you can also use the keyboard shortcut CONTROL + ALT + 0 to hide all the selected columns.